


Solar Power's Tipping Point, Flying Cars, and Energizing Your Daily Routine
The Daily Grind July 10, 2025: Tech's morning newsletter, featuring one headline, one page of a great book, and one question to ponder

Hello!
Welcome to The Daily Grind for Thursday, July 10.
Today we are talking about ENERGY, and where we are increasingly getting ours from (hint: look up).
We also have a few good links on X’s leadership shakeup, AI web browsers, Cluely vs. Truely, and Cameo’s attempt at a bounceback.
First, if you’ve enjoyed The Daily Grind this week, consider forwarding this email to one person.
Let’s get into it:

Photograph by Hu Huhu / Xinhua / Redux
📰 One Startup Headline: We have reached the tipping point for solar energy
The rate at which solar energy is improving and expanding is hard to wrap your head around. We may have just reached a tipping point without anyone realizing.
Author Bill McKibben shared numerous data points in an excerpt from his new book.
Here are the first four:
It took from the invention of the photovoltaic solar cell, in 1954, until 2022 for the world to install a terawatt of solar power; the second terawatt came just two years later, and the third will arrive either later this year or early next.
That’s because people are now putting up a gigawatt’s worth of solar panels, the rough equivalent of the power generated by one coal-fired plant, every fifteen hour. Solar power is now growing faster than any power source in history, and it is closely followed by wind power—which is really another form of energy from the sun, since it is differential heating of the earth that produces the wind that turns the turbines.
Last year, ninety-six per cent of the global demand for new electricity was met by renewables, and in the United States ninety-three per cent of new generating capacity came from solar, wind, and an ever-increasing variety of batteries to store that power.
In March, for the first time, fossil fuels generated less than half the electricity in the U.S. In California, at one point on May 25th, renewables were producing a record hundred and fifty-eight per cent of the state’s power demand. Over the course of the entire day, they produced eighty-two per cent of the power in California, which, this spring, surpassed Japan to become the world’s fourth-largest economy.
He goes on to share that Texas is building more solar than California and reduced its chances of a power blackout from 16% to less than 1%. Elsewhere, China is now producing half the world’s solar power while also supplying energy revolutions in the Middle East and Africa.
What’s astounding is how wrong our predictions about solar have been. When it comes to technologies like microchips, we have a pretty good sense of the pace of change (aka Moore’s Law). With solar energy, we are continually surprised.
Here’s McKibben again:
“In 2009, the International Energy Agency predicted that we would hit two hundred and forty-four gigawatts of solar capacity by 2030; we hit it by 2015.”
“For most of the past decade, the I.E.A.’s five-year forecasts missed by an average of two hundred and thirty-five per cent.”
Despite efforts of the US government to stall renewable energy build outs, we may have already reached a tipping point. Solar, wind, and battery technology have become so inexpensive and efficient that we will keep building.
What does this mean for entrepreneurs?
The demand for solar energy—especially for commercial uses—is far outpacing US manufacturing and installation capabilities.

The US needs solar panel manufacturers, key component builders (China currently creates 97% of the world’s solar wafers), and solar installers.
The attack on government subsidies may scare off potential solar entrepreneurs, but it might be a blessing in disguise. With market-rate costs and pricing, solar companies may be able to build more sustainable businesses that are not reliant on subsidies.
A Few Good Links:
Here are some other stories worth exploring:
TechCrunch: Perplexity launches Comet, an AI-powered web browser
TechCrunch: Why Cluely’s Roy Lee isn’t sweating cheating detectors
TechCrunch: Cameo’s birthday reminder app, Candl, is a weak attempt at a comeback
📚 One Page: Where is My Flying Car? by J. Storrs Hall
Energy is everything.
This was my big takeaway from J. Storrs Hall’s account of futures past, present and (yes) future, Where is My Flying Car?
The flying car, in this book, is a totem through which Hall explains how technological innovation accelerated—and then stalled—in the United States. In short, we were supposed to have flying cars by now, but we don’t. Why?
Energy.
This page puts the our energy stagnation into historic perspective:
The Henry Adams Curve
Henry Adams, scion of the house of the two eponymous presidents, wrote in his autobiography about a century ago:
The coal-output of the world, speaking roughly, doubled every ten years between 1840 and 1900, in the form of utilized power, for the ton of coal yielded three or four times as much power in 1900 as in 1840.
As rapid as this rate of acceleration in volume seems, it may be tested in a thousand ways without greatly reducing it. Perhaps the ocean steamer is nearest unity and easiest to measure, for any one might hire, in 1905, for a small sum of money, the use of 30,000 steam-horsepower to cross the ocean, and by halving this figure every ten years, he got back to 234 horsepower for 1835, which was accuracy enough for his purposes.⁽²⁹⁾
In other words, going back at least to the Newcomen and Savery steam engines of 300 years ago, we have had a very steady trend of about 7 percent yearly growth in usable energy available to our civilization. Let us call it the “Henry Adams Curve.”
The optimism and constant improvement of life in the 19th century and the first half of the 20th can quite readily be seen as predicated on this curve. To a first approximation, it can be factored into a 3 percent population growth rate, a 2 percent energy-efficiency growth rate, and a 2 percent growth in actual energy consumed per capita.
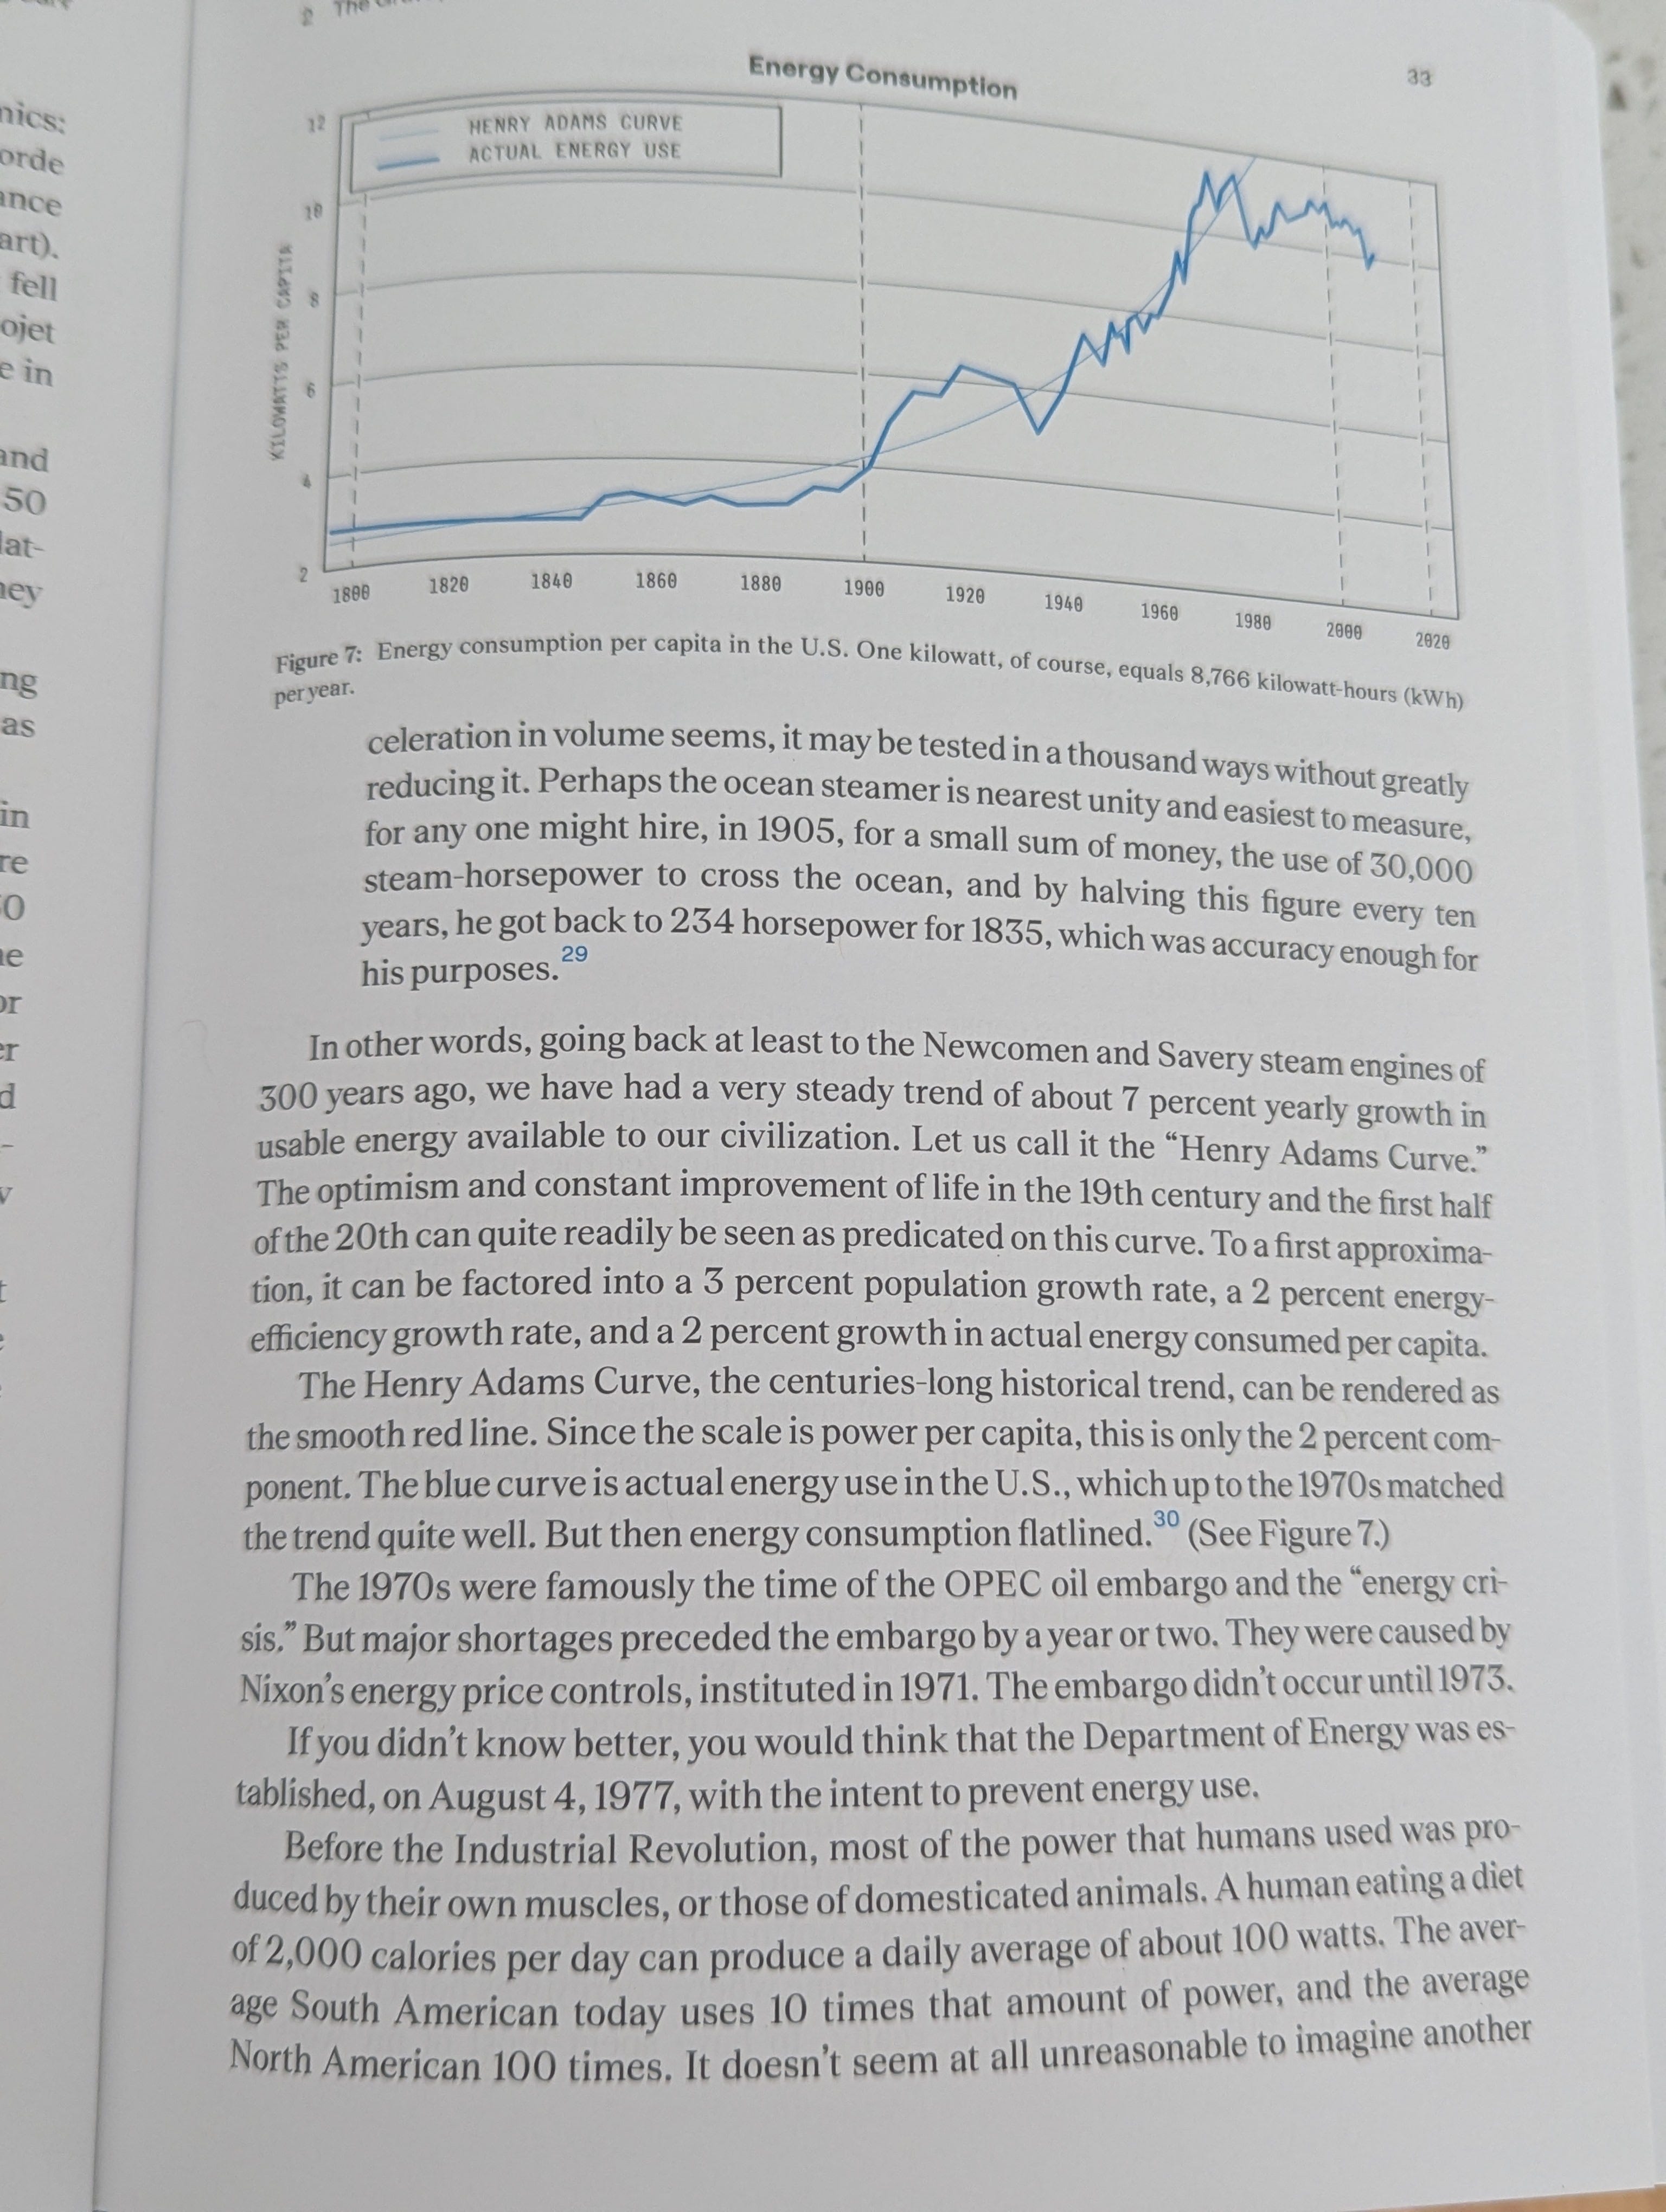
The Henry Adams Curve, the centuries-long historical trend, can be rendered as the smooth red line. Since the scale is power per capita, this is only the 2 percent component. The blue curve is actual energy use in the U.S., which up to the 1970s matched the trend quite well. But then energy consumption flatlined.⁽³⁰⁾ (See Figure 7.)
The 1970s were famously the time of the OPEC oil embargo and the “energy crisis.” But major shortages preceded the embargo by a year or two. They were caused by Nixon’s energy price controls, instituted in 1971. The embargo didn’t occur until 1973.
If you didn’t know better, you would think that the Department of Energy was established, on August 4, 1977, with the intent to prevent energy use.
Before the Industrial Revolution, most of the power that humans used was produced by their own muscles, or those of domesticated animals. A human eating a diet of 2,000 calories per day can produce a daily average of about 100 watts. The average South American today uses 10 times that amount of power, and the average North American 100 times. It doesn’t seem at all unreasonable to imagine another Industrial Revolution giving us another factor of 10, or even another 100.
Pair this book with Abundance by Derek Thompson and Ezra Klein to put the scientific and political picture on energy together.
❓ One Question: What gives you energy?
Energy is the lifeblood of society, but also our individual lives.
It’s easy to get stuck in a routine without questioning how or why you’re doing things. So ask yourself:
What are three things that gave me energy this week?
What are three things that sucked my energy?
If you’re struggling to recall, try journaling on this throughout the day today. Once you complete a task, ask yourself, did this give me energy (I.e., could I keep doing this again and again?), or did it drain me?
🗳️ Wrap Up and Feedback
That’s it for today’s Daily Grind!
I started this newsletter exactly a week ago, and I can say it gives me energy each morning. But I want to make it as useful as possible.
In addition, please reply to let me know what part of today’s newsletter you found most interesting (if any at all).
Thanks! Have a great day.
Cheers,
Ben
Nice to read positive news about solar power!